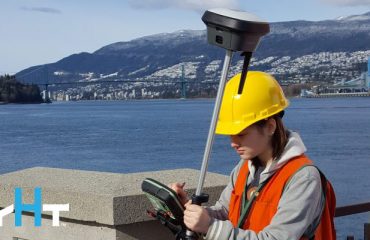
If you’re still tracking your campaign monitoring results in spreadsheets, here’s an easy way to do it better.
You probably already handle monitoring projects, even if you don’t know it yet. If you’ve ever worked on a project that requires periodic resurveying in order to track movement, you’ve provided monitoring services.
At its core, monitoring is surveying. Whether it takes the form of tracking movement in bridges, buildings, dams, landslides or railroads, monitoring protects life and assets while simultaneously limiting liability and damages.
Many projects require extremely high precision and 24/7 monitoring. For these, a dedicated instrument is installed onsite to continually monitor the location. This installed solution requires the instrument to be mounted to a stable foundation, connected to a constant source of power, and maintain ongoing communications with the internet for data upload and transfer.
 “Replacing spreadsheets with a campaign monitoring app gives your team and clients a way interact with the data. They can look at it and understand it. The graphing capabilities lay out the information so you can easily spot trends and efficiently manage your project.”
– William T. Derry, Prof. LS
For some projects, however, campaign (periodic) monitoring is sufficient. By combining a flexible campaign monitoring approach with basic automation granted by developments in monitoring software applications, you can capture the same data with fewer resources and create significantly better visualizations for your clients—giving you an easy way to grow your business in this high-demand field.
The Limitations of Traditional Campaign Monitoring
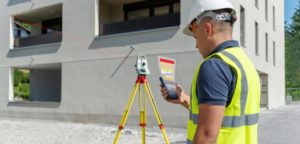
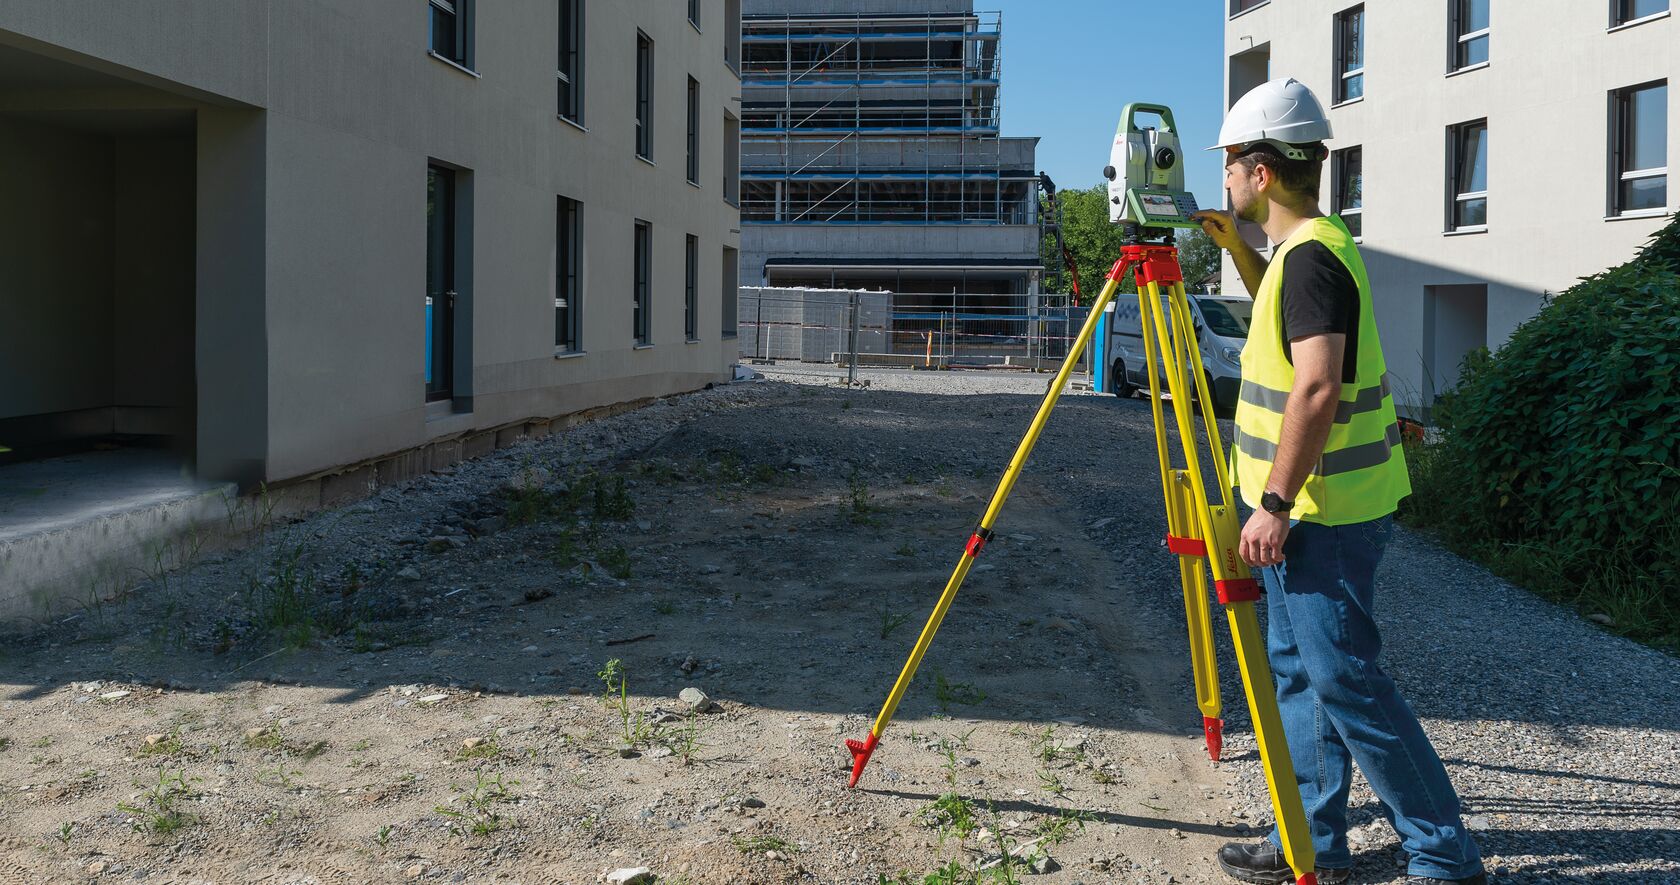
Campaign monitoring consists of a crew repeatedly visiting a site and resurveying in order to track potential displacement. Companies usually employ this method for projects that require short-term data collection, adherence to a non-intensive schedule, and low-impact project presence. Campaign monitoring is built on the combination of a competent surveying crew, the appropriate hardware, and a solid procedure for measurement repeatability.
The typical workflow of a campaign monitoring project begins when the field crew visits the site and collects the displacement data. That data is then processed, loaded into a spreadsheet, and examined manually before delivering it to the client.
The inevitable copying and pasting of significant volumes of data into computers and programming formulas into spreadsheet software creates a variety of areas where workers can inadvertently introduce errors. Measurements may not be as accurate as desired if the surveying was not performed correctly, and flaws could be introduced into the data as it is manually arranged and examined on the computer. Although this workflow has been the standard for years, it’s long overdue for a change.
Increasing Efficiency and Accuracy with a Monitoring App
Advances in software let you combine partial automation with a campaign monitoring workflow to take your monitoring business to the next level.
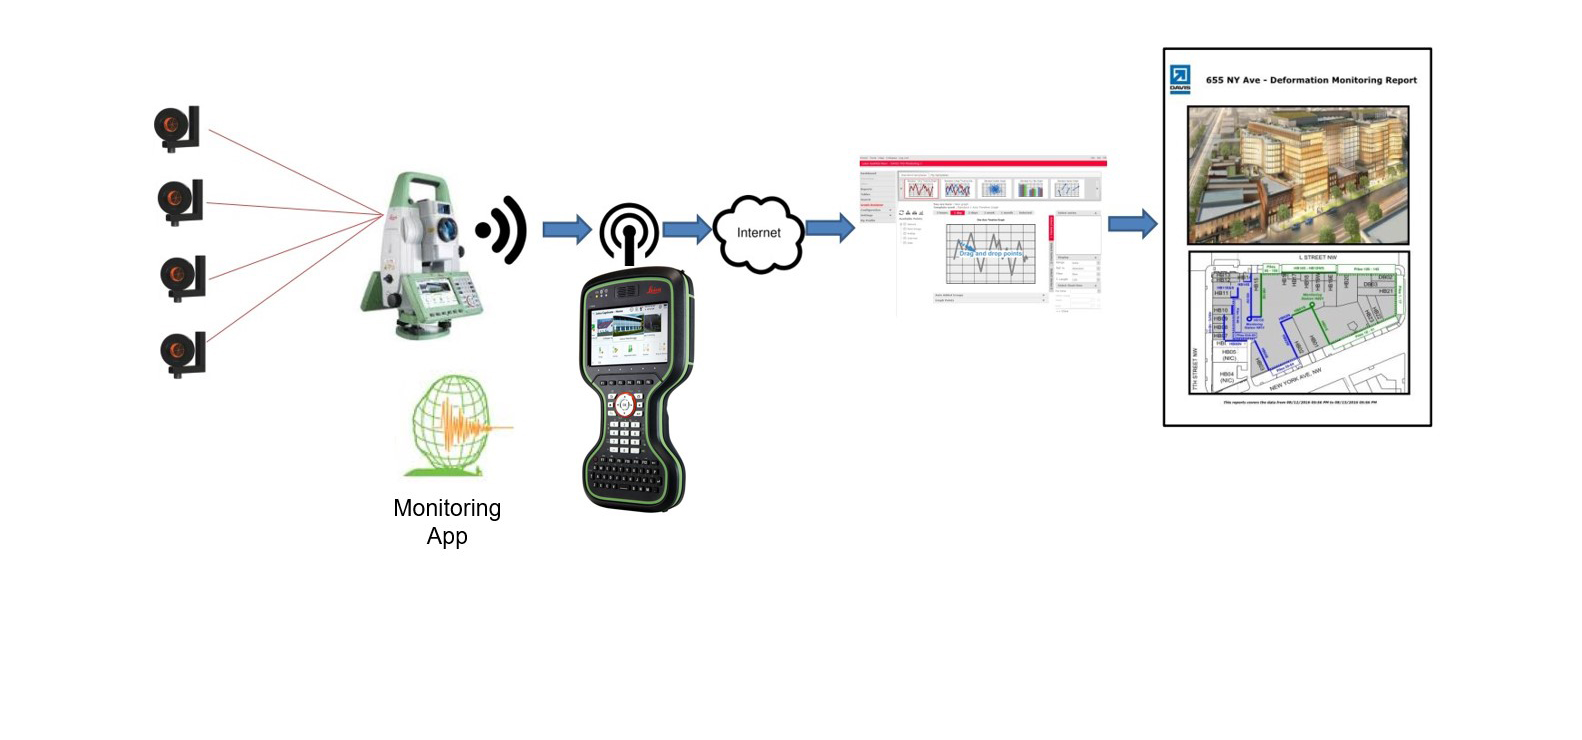
For example, Leica GeoMoS Now! Survey Edition, an inexpensive and easy-to-use application for Leica Captivate software, allows you to set up the workflow once and then run it on subsequent visits with just a few button presses. The app automatically guides the survey instrument to measure those same points again automatically and perform quality checks in the process. As a result, you achieve higher accuracy and repeatability in much less time.
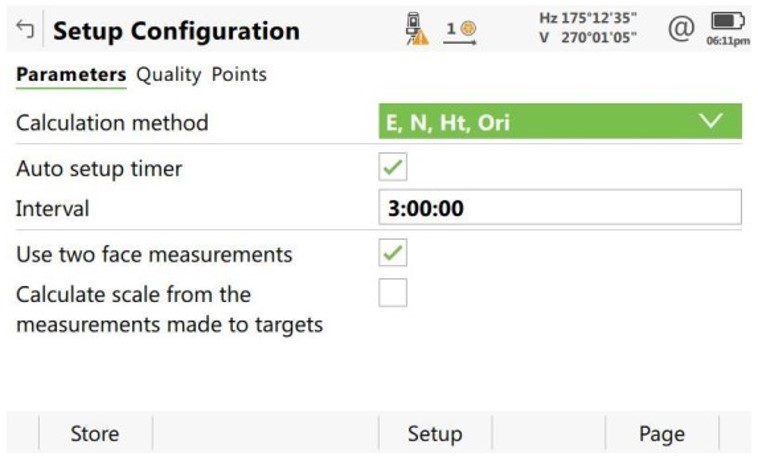
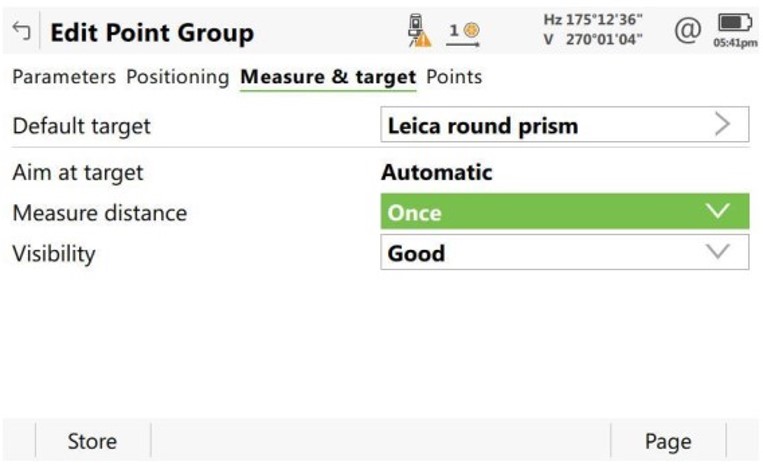
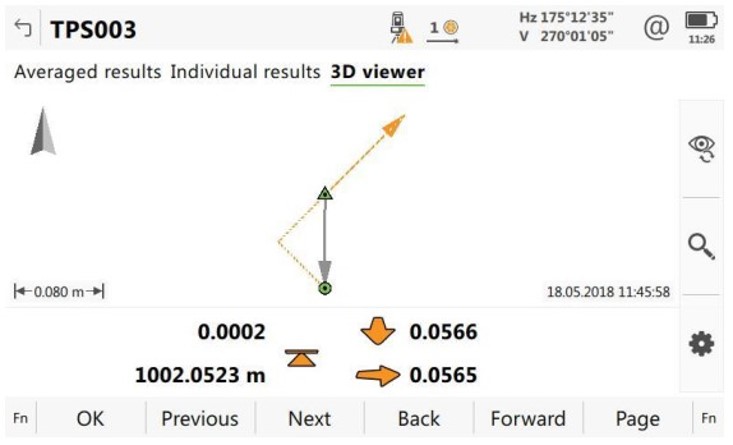
You can also customize settings so all monitoring is reported in relation to a baseline (for example, a road or embankment wall); create, use, and manage as many point groups as desired; and incorporate two-face measurement for projects requiring ideal precision and longer-distance measurement.
Following the data collection, the application lets you transfer processed measurement data over the internet to the GeoMoS Now!, a web-based application that allows for easy data visualization, analysis, and future export. GeoMoS Now! can automatically generate displacement graphs and email scheduled reports to designated recipients. The visualizing of data helps you and your clients intuitively understand the displacement occurring at a given point in time.
Delivering Trusted Results with Fewer Resources
If you’re involved in campaign monitoring (and most surveyors are), even small modifications to your current processes can have a big impact. Automation reduces errors and allows for human labor to be redirected to new projects, rather than being tied up in manual processes. This keeps clients satisfied, saves money, and opens opportunities for future business growth.
Note: This insight is from the webinar, Easy Ways to Launch and Grow Your Monitoring Capabilities. Watch the full webinar here >
To talk to one of our experts and learn more about solutions for surveying and mapping, please contact us.
