When establishing a deformation monitoring network, knowing how to adjust and analyze the network is crucial to success.
“Least squares adjustment” is a phrase that most surveyors and engineers use and a technology that many of us apply in the course of a work week, but our actual understanding of least squares adjustment, or network adjustment and analysis in general, can be a little hazy.
By definition, a least squares adjustment “fits the observations of a network into their functional model by minimizing the sum of squares of residuals.”* Not all network operators have to think a lot about adjustment; as a rule (and in the absence of extreme accuracy requirements), smaller networks with just one or two sensors and only a few monitored points don’t really need sophisticated adjustment, especially if terrestrial sensors (total stations) and GNSS receivers are not being mixed. But as the number of sensors and monitored points rises, adjustment and analysis does become an important factor—for one thing, when deformation or movement is detected in large networks, just figuring out which points or sensors are moving can be a chore, although tools are available that can help with this.
Why Network Adjustment?
Two major factors make adjustment necessary in large networks:
First, monitoring systems are designed to run 24/7 in critical situations and acquire observations from multiple sensors. Usually every one of these observations is carried out multiple times, day after day and ideally with different sensors. These “extra” observations are called in technical terminology, redundancy data and are either caused by repeat measurements or alternative determination of a measured quantity.
Second, every observation is only a random or stochastic (randomly determined) value. If you measure, for example, a distance from point A to point B with a simple electronic distance meter multiple times, the result will never be the true value. The measured value will only be distributed around the true value.
The network adjustment is based on redundant data and their distributions. The results are normal distributed stochastical values.*
In other words, we know when we take any measurement that we will never get the absolute, true value to infinite precision—there are limits to all measurement technology. Moreover, the precise distance between any two points varies (perhaps trivially) from moment to moment. The crucial difference, in monitoring networks, is that point positions are measured multiple times, often from multiple sensors. And, these multiple position measurements can be compared to all the other points in the network. This creates a great deal of redundancy, and the redundancy can be exploited, via least squares adjustment and other methods, to improve the accuracy and resiliency of monitoring efforts. We can, for example, filter out deformations caused by seasonal temperature change, and other factors.
 “Network adjustment improves accuracy and helps us to improve the network itself, while deformation analysis informs us about change in the real world, and fulfills the purpose of the network. You can’t do one without the other.”
– Craig Hewes, PLS
Network Adjustment v. Deformation Analysis
It’s useful to distinguish between network adjustment and deformation analysis.
Network adjustment is used to look at a single epoch (one cycle or set of observations) and use least squares adjustment to derive the most accurate observations possible, given the network’s configuration and setup. Adjustment can be also be used for what we might call meta-analysis; that is, to estimate the expected reliability and accuracy of the network itself, based on its configuration.
Deformation analysis, by contrast, analyzes an epoch by comparing it to one or more previously collected epochs. And of course, since it measures and reports on change (deformation) from epoch to epoch, deformation analysis is the whole point of establishing a monitoring network. Deformation analysis can tell us the statistical significance of movements in sensors and monitored points and groups of points, detect instability in individual points which may not be significant to project goals, and can tell us the vectors of significant movements.
So, network adjustment improves accuracy and helps us to improve the network itself, while deformation analysis informs us about change in the real world, and fulfills the purpose of the network. You can’t do one without the other.
The Importance of Epochs
Comparing epochs in deformation analysis is not as simple as looking back at a previously collected epoch. Suppose, for example, that you are monitoring an earth dam, and collect epochs in two daily cycles: morning and late afternoon. It is of little use to compare a morning epoch to a late afternoon epoch, since simple thermal expansion can cause change that may be alarming but ultimately insignificant. Likewise, comparing morning epochs from summer and winter is not likely to be useful and, depending on the project site, even comparing epochs from the same time of day but on Sunday versus a weekday can be problematic. Conversely, comparing an 8:00 a.m. epoch one day to an 8:00 a.m. epoch collected the previous day, or exactly one year earlier, will usually yield the desired information.
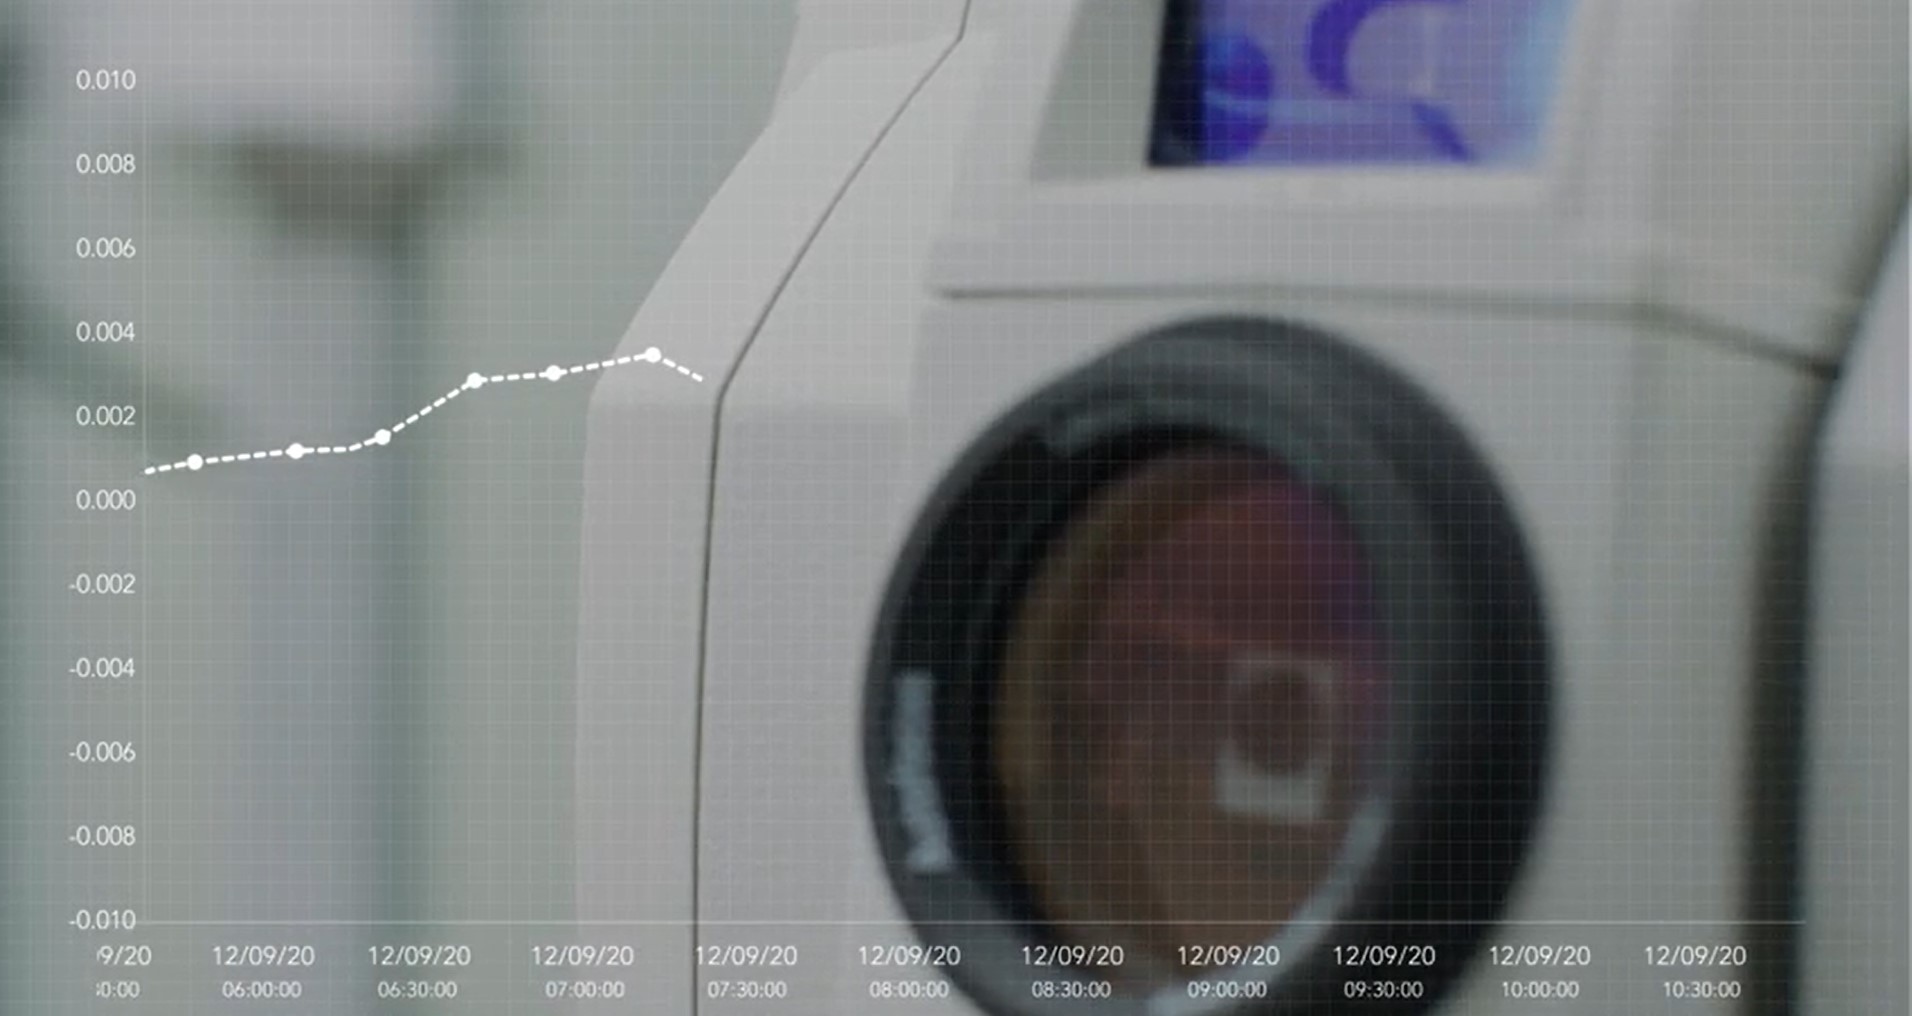
Therefore, network operators should think carefully about collection time of epochs, and the particulars of their project site, when setting up monitoring networks. They should also allow significant time for establishing baseline epochs for comparison, which can take several weeks. Due to continuous epoch collection and comparison, deformation analysis tends to become more useful and reliable over time, and anomalies (both significant and insignificant) become easier to detect. When evaluating a monitoring solution, look for software that enables you to easily create charts that show variation in error ellipses over any period the network has been in existence.
About the Author:
 Craig S. Hewes, PLS, is a licensed land surveyor who is experienced in supertall building construction and asset monitoring. For nearly 15 years, Craig served as Leica Geosystems' director of monitoring for the Eastern US and Canada. In his current role as Leica Geosystems' senior strategic account manager, Craig helps surveying and engineering organizations achieve new levels of success through a strategic partnership approach to technology adoption.
To talk to one of our experts and learn more about solutions for surveying and monitoring, please contact us.
